The Earth Occultation Technique with The Burst and Transient Source Experiment
By C.A. Wilson, B.A. Harmon, M.L. McCollough, G.J. Fishman, W.S. Paciesas, & S.N. Zhang
Abstract
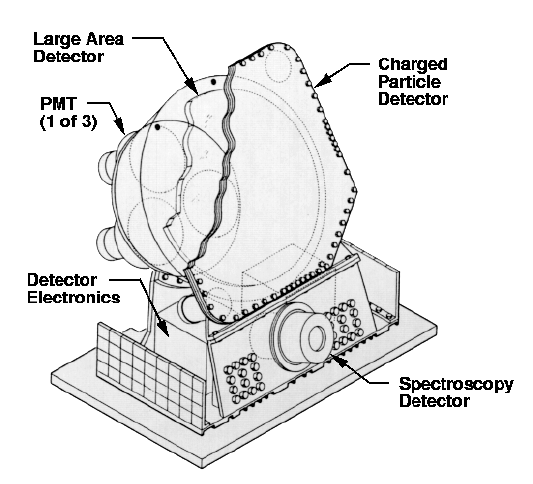
The Burst and Transient Source Experiment (BATSE) on the Compton Gamma Ray Observatory (CGRO) is successfully being used as an all-sky nearly-continuous hard X-ray monitor. The experiment consists of a set of eight uncollimated detectors sensitive to photons in the 20 keV to 2MeV range. Since CGRO orbits the Earth at an altitude of about 450 km, about 33% of the sky, as viewed with BATSE, is covered by the Earth at any give time. The entire sky is subject to Earth occultation for some portion of CGRO's 52 day precession period. When a source sets below (or rises above) the Earth's limb, atmospheric attenuation produces step-like features in the BATSE data. The observed change in count rate in several energy bands provides a measurement of the source intensity and spectrum without sophisticated background models. These occultation features are used to located and monitor astrophysical sources with BATSE when the source signal can be separated from the detector background. Examples of step searches, spectra, light curves, and transform imaging are presented.
The Compton Gamma-Ray Observatory (CGRO) and BATSE modules


BATSE Large Area Detectors:
NaI(Tl) Scintillation Crystals
Geometric Area: 2025 cm2
Thickness: 1.27 cm
Field of View: 4Π steradians
Energy Range: 20 keV - 2MeV
Continuous Data Types:
•CONT: 2 second, 16 channel (used for Earth occultation step fits and step searches)
•DISCLA: 1 second, 4 channel (used for Earth occultation imaging)
BATSE Spectroscopy Detectors are not used for standard Eath occultation analysis. (See McNamara et al 1998, ApJS, 166,287, for occultation analysis using the spectroscopy detectors.)
BATSE Earth Occultation Analysis Summary
Basic Step Fitting:
Earth occultation steps are fitted to measure intensities and spectra for known sources.
Imaging
The Earth's limbs are projected on the sky for occultation steps for several days. The motion of these limbs allows us to locate new sources with a location accuracy of 0.1-0.5 degrees and an angular resolution of 0.5-1 degrees in a 1-day image of 20-50 keV data, not including systematic effects (Zhang, S.N. et al 1995, Exp. Astr. 6,57).
Step Searches
Times and significances are accumulated for occulation steps thoughout one day to search for new sources.
Source Types Observered with BATSE Earth Occultation

BATSE Earth Occultation Observations

Earth Occultation Steps in the BATSE DATA

BATSE Earth Occultation Step Fits

Occultation Step Fits with BATSE

Shown are step fits to setting and rising steps. The black histogram denotes BATSE CONT data. The solid red curve is the step model fit, which includes a quadratic background plus source terms for 1E 1740-29 and GM Sagittarius. The vertical green dotted line is the predicted step time for GM Sagittarius.
110 Seconds of BATSE CONT data either side of the measured step are fit
with the model:
\[ \lambda(t) = {\sum_{j=0}^3 b_j(t - t_{occ})^j} + {\sum_{n=1}^N s_n T_n(t)} \]
WHERE:
- \[ \lambda(t) \] is the model count rate
- \[ t_{acc} \] is the predictd occultation time
- \[ b_j \] are background coefficients
- \[ s_n \] is the source intensity in counts \[ s^{-1} \] for source \[ n \]
- \[ T_n(t) = exp\left\{-\mu(E)A(h(t))\right\} \] is the atmospheric
transmission function
- • \[ \mu(E) \] is the energy dependent mass attenuation coefficient
- • \[ A(h(t)) \] is the air mass at altitude h at time t.
Transient Source Light Curves

Persistent Source Light Curves

Spectrum Measured with BATSE Earth Occultation

BATSE Earth Occultation Step Searches

Earth Occultation Step Search Results

Shown are occultation step significances from the step search. Positive values are rises; negative values are sets. Steps with significance > 8 sigma are labeled with the source name.
BATSE Earth Occultation Imaging[1]

Motion of the Earth's Limb on the Sky

Shown is the rising and setting Earth limbs at the time of Crab occultations on 1995 August 11-15 projected onto the sky. The limbs move in a clockwise direction with time. Data from these Crab steps were used to create the image is also shown.
Earth Occultation Image of the Crab Nebula from 1995 August 11-15 Data

Author: Colleen Wilson-Hodge
Responsible Manager: Steve Elrod
Site Curator: Valerie Connaughton
